The 10 Most Traded Stocks on the Stock Exchange
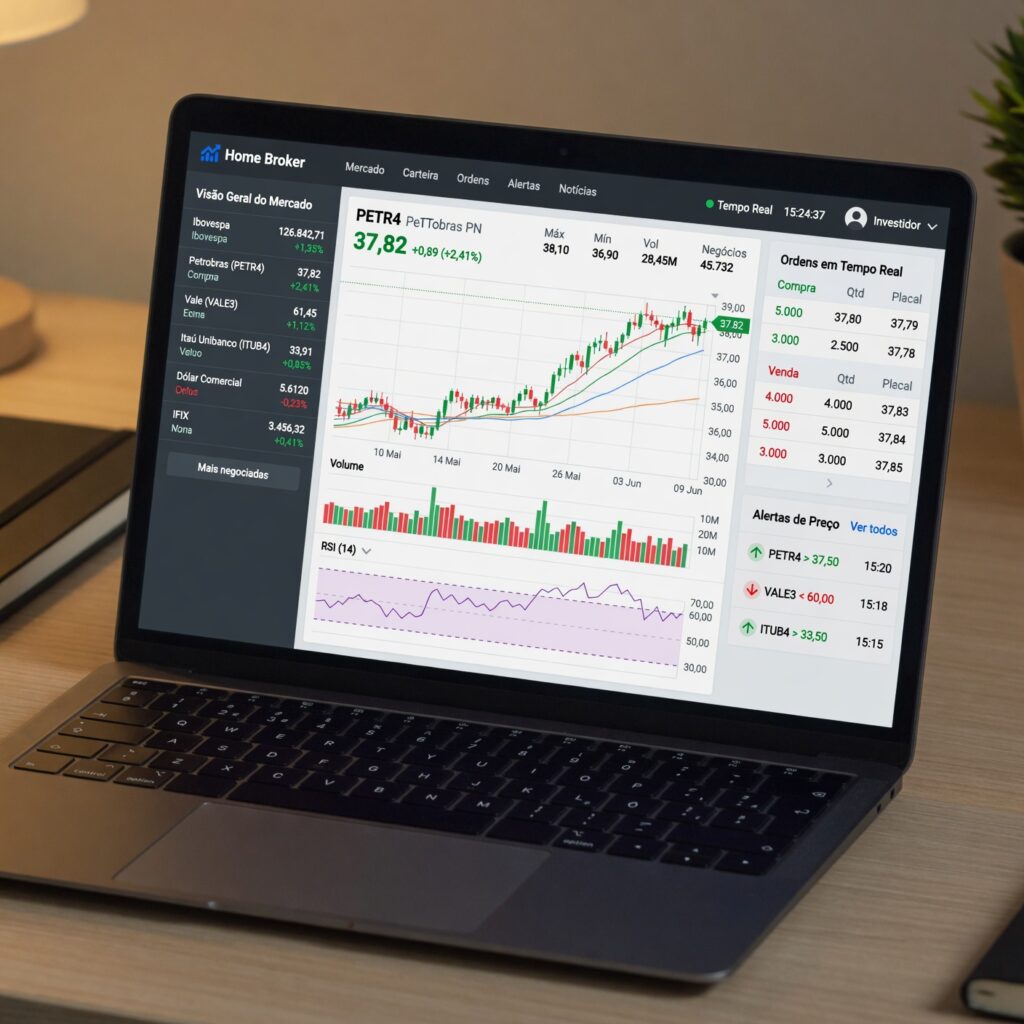
image for illustrative purposes only.
This comprehensive guide breaks down the 10 most traded stocks on the market, explores the underlying mechanics of market liquidity, examines why share volume and dollar volume tell two different stories, and highlights key strategies for trading high-volume equities effectively.
Understanding Stock Market Liquidity and Trading Volume

Before examining individual stock profiles, it is critical to define what trading volume represents and why it remains one of the most vital technical indicators in finance.
At its core, trading volume measures the total number of shares bought and sold for a given security during a specified timeframe—typically a single trading session. Every time a seller transacts with a buyer, those shares are added to the cumulative daily volume tally.
Liquidity refers to how quickly and easily an asset can be converted into cash without causing a dramatic disruption in its market price. High volume directly correlates with high liquidity. When a stock trades tens of millions of shares daily, buyers and sellers can enter and exit positions almost instantaneously at fair market values.
Why High Trading Volume Matters to Investors and Traders
- Tight Bid-Ask Spreads: High-volume stocks feature minimal price discrepancies between the highest price a buyer is willing to pay (the bid) and the lowest price a seller is willing to accept (the ask). Tight spreads lower transaction friction, preserving capital for traders.
- Reduced Slippage: Slippage occurs when an order executes at a price significantly different from expected. In liquid equities, large market orders are absorbed easily by deep order books, minimizing unwanted price slippage.
- Enhanced Price Discovery: When millions of market participants interact with a stock simultaneously, the prevailing share price reflects all publicly available information, news, and market expectations in real time.
- Reliable Technical Indicators: Technical analysis patterns, chart breakouts, and support or resistance levels carry far more statistical validity when backed by heavy trading volume compared to low-volume illiquid stocks.
Share Volume vs. Dollar Volume: Why Both Metrics Matter
When evaluating the most active equities, market analysts distinguish between two fundamental metrics: share volume and dollar volume. Confusing the two can lead to a skewed perception of actual market activity.
- Share Volume: The total count of individual physical shares exchanged during the day. A low-priced stock trading at $5 per share might easily record 100 million shares traded in a session, equaling $500 million in monetary movement.
- Dollar Volume: The total monetary value of all traded shares, calculated by multiplying the number of shares traded by the execution price. If a high-priced stock trading at $200 per share exchanges 50 million shares, its total dollar volume reaches an astonishing $10 billion.
While low-priced growth or turnaround stocks often top raw share volume charts due to retail affordability, mega-cap blue-chip equities consistently dominate dollar volume rankings. Both metrics are valuable: share volume reveals sheer order flow frequency and retail engagement, whereas dollar volume highlights where institutional capital and smart money are actively deployed.
The Top 10 Most Traded Stocks in the Stock Market
The following ten companies represent the pinnacle of stock market liquidity. They consistently lead global exchanges in daily share volume, total dollar turnover, options liquidity, and institutional order execution.
| Company Name | Ticker | Primary Industry | Main Volume Driver |
|---|---|---|---|
| Nvidia Corporation | NVDA | Semiconductors / AI | Artificial Intelligence Hardware Demand |
| Tesla, Inc. | TSLA | Automotive / Clean Tech | Retail Sentiment & EV Market Dynamics |
| Apple Inc. | AAPL | Consumer Electronics | Global Institutional Benchmark Holding |
| Advanced Micro Devices, Inc. | AMD | Semiconductors | Data Center & Chip Sector Competition |
| Amazon.com, Inc. | AMZN | E-Commerce / Cloud | Cloud Infrastructure & Consumer Spending |
| Microsoft Corporation | MSFT | Software / Enterprise | AI Integration & SaaS Revenue Growth |
| Meta Platforms, Inc. | META | Social Media / Tech | Digital Advertising & AI Infrastructure |
| Intel Corporation | INTC | Semiconductors | Corporate Turnaround & Foundry Expansion |
| Alphabet Inc. | GOOGL | Search / Digital Ads | Search Monopoly & AI Model Rollouts |
| Palantir Technologies Inc. | PLTR | Enterprise Software | Government & Enterprise AI Contracts |
1. Nvidia Corporation (Ticker: NVDA)

Nvidia Corporation stands as the undisputed center of gravity for global market liquidity. As the primary provider of high-performance graphics processing units (GPUs) power computational workloads, machine learning, and generative artificial intelligence, Nvidia attracts unparalleled capital flow from institutional asset managers, hedge funds, and retail traders alike.
Why Nvidia Command Unmatched Volume
- AI Hardware Hegemony: Nvidia holds a dominant market share in data center AI accelerators. Every earnings release, product announcement, and supply chain update ripples across the entire global technology sector.
- Options Market Dominance: NVDA options contracts are among the most heavily traded financial derivative instruments in the world. Rapid movements in option open interest frequently trigger gamma squeezes, forcing market makers to buy or sell underlying shares to hedge risk, further amplifying daily share volume.
- Institutional Ownership: As a core constituent in major benchmarks like the S&P 500 and Nasdaq-100, index funds and actively managed funds trade massive blocks of NVDA stock daily to adjust portfolio weightings.
2. Tesla, Inc. (Ticker: TSLA)

Tesla, Inc. has long been a titan of market activity, combining pioneering electric vehicle manufacturing with autonomous software development, energy storage solutions, and robotics initiatives. TSLA consistently ranks near the top of both share volume and dollar volume leaderboards due to its high volatility and massive retail investor following.
Key Trading Dynamics for TSLA
- High Historical Volatility: Tesla’s price swings attract short-term momentum traders, swing traders, and day traders seeking intraday price expansion.
- CEO and Macro Sensitivity: Corporate announcements, executive updates, regulatory shifts, and broader electric vehicle adoption trends keep Tesla perpetually in the daily news cycle.
- Retail and Institutional Tug-of-War: Few stocks exhibit such an intense balance between passionate retail individual investors and institutional short sellers or value funds, guaranteeing perpetual order execution liquidity.
3. Apple Inc. (Ticker: AAPL)

Apple Inc. represents the quintessential institutional mega-cap benchmark stock. Known for its world-class balance sheet, massive consumer ecosystem, robust hardware lineup, and recurring services revenue, Apple serves as a foundational holding for pension funds, sovereign wealth funds, mutual funds, and individual portfolios worldwide.
Volume Breakdown for Apple
- Unrivaled Capital Allocation: With a multi-trillion-dollar market capitalization, even small percentage moves in Apple represent billions of dollars shifting hands.
- Massive Share Repurchase Program: Apple consistently executes one of the largest corporate share buyback programs in corporate history, purchasing tens of millions of its own shares off the open market each quarter.
- Flight-to-Safety Asset: During macroeconomic uncertainty, institutional investors frequently park capital in Apple due to its immense cash reserves and predictable cash flow, generating sustained trading volume in all market environments.
4. Advanced Micro Devices, Inc. (Ticker: AMD)

Advanced Micro Devices, Inc. is a major powerhouse in the semiconductor space, competing aggressively in central processing units (CPUs), graphics processors, and specialized data center chips. Because the semiconductor industry is highly cyclical and central to the modern global economy, AMD experiences intense daily trading turnover.
Market Factors Influencing AMD Volume
- Semiconductor Sector Correlation: AMD frequently trades in tandem with broader chip indices, making it a primary vehicle for traders taking macro bets on technology infrastructure.
- Competitive Product Cycles: Product launches targeting data centers, personal computing, and gaming hardware trigger substantial repositioning by institutional analysts and fund managers.
- High Liquidity for Active Traders: AMD offers exceptional intraday chart structure and tight bid-ask spreads, making it a favorite instrument for professional day traders and automated algorithmic execution strategies.
5. Amazon.com, Inc. (Ticker: AMZN)

Amazon.com, Inc. operates at the intersection of global e-commerce logistics, cloud computing infrastructure via Amazon Web Services (AWS), digital advertising, and digital media streaming. Its stock acts as a primary barometer for global consumer spending health and enterprise technology investment.
Drivers of Amazon’s Daily Volume
- AWS Cloud Performance: As enterprise digital transformation continues, cloud expenditure growth reported by AWS serves as a key catalyst for structural institutional buying or selling.
- Seasonal Consumer Cycles: High-volume trading surges around major shopping events like Prime Day, Black Friday, and the Q4 holiday quarter.
- Broad ETF Inclusion: AMZN is heavily weighted in consumer discretionary and technology exchange-traded funds (ETFs), ensuring steady, passive inflows and outflows throughout every trading session.
6. Microsoft Corporation (Ticker: MSFT)

Microsoft Corporation is one of the most stable and broadly diversified enterprise technology conglomerates on earth. With market-leading positions in cloud computing (Azure), enterprise software suites, cybersecurity, gaming, and artificial intelligence integration, MSFT is a mandatory portfolio component for institutional asset managers.
Structural Volume Drivers for Microsoft
- Predictable Enterprise Cash Flows: Microsoft’s software-as-a-service (SaaS) business model creates exceptional revenue visibility, attracting mega-cap institutional funds that rebalance positions in high volume.
- Enterprise AI Commercialization: As Microsoft monetizes AI capabilities across its cloud and software products, quarterly financial updates drive immense institutional repositioning.
- Systemic Market Weight: Due to its immense market capitalization, MSFT receives constant passive bid flow from automated index fund inflows.
7. Meta Platforms, Inc. (Ticker: META)

Meta Platforms, Inc., owner of Facebook, Instagram, WhatsApp, and Threads, is the global leader in social networking and digital performance advertising. Combining massive free cash flow generation with large-scale investments in artificial intelligence data center infrastructure, Meta commands exceptional daily dollar volume.
Why Meta Attracts Continuous Capital Flow
- Digital Advertising Barometer: Meta’s earnings results offer immediate clarity into corporate advertising budgets, consumer engagement trends, and macroeconomic health.
- Aggressive Capital Efficiency: Significant structural operational changes, dividend introductions, and multi-billion-dollar share repurchase updates make META a high-conviction instrument for hedge funds.
- Dynamic Price Action: Meta frequently experiences sharp earnings gap movements, establishing high volatility zones that attract technical momentum strategies for weeks following announcements.
8. Intel Corporation (Ticker: INTC)
Intel Corporation represents a unique high-volume stock on Wall Street. While navigating a multi-year corporate transformation into a commercial semiconductor foundry, Intel trades massive daily share volume, often exceeding 50 to 100 million shares in a single session.
Key Factors Behind Intel’s Massive Share Volume
- Accessible Share Price: Relative to high-priced tech peers, Intel’s lower per-share stock price allows retail and institutional traders to control larger lot sizes efficiently.
- Turnaround Catalyst Play: Investors actively trade INTC around government subsidy announcements, foundry partnership milestones, and restructuring progress.
- High Option Open Interest: Intel features a highly liquid options chain across all expiration cycles, driving significant hedging activity from market makers.
9. Alphabet Inc. (Ticker: GOOGL / GOOG)

Alphabet Inc., the parent company of Google, YouTube, and Google Cloud, maintains a virtual monopoly in digital search while expanding rapidly into cloud services and autonomous vehicle technology via Waymo. Its dual class shares (Class A GOOGL and Class C GOOG) combined generate massive global daily dollar volume.
Factors Sustaining Alphabet’s High Liquidity
- Dominant Search Engine Revenues: Google Search generates unmatched digital cash flow, providing Alphabet with a resilient balance sheet during turbulent market conditions.
- Cloud and AI Expansion: Rapid revenue growth within Google Cloud makes Alphabet a premier choice for institutional funds acquiring enterprise tech exposure.
- Consistent Liquidity Across Share Classes: Both GOOGL (with voting rights) and GOOG (non-voting) maintain deep order books, ensuring institutional order execution with near-zero slippage.
10. Palantir Technologies Inc. (Ticker: PLTR)

Palantir Technologies Inc. specializes in big data analytics, artificial intelligence platforms, and decision-making software for military, intelligence, and commercial enterprise clients. PLTR has emerged as one of the most actively traded software growth equities on the market.
Trading Characteristics of Palantir
- Massive Retail & Institutional Synergy: Palantir possesses one of the strongest social communities and retail trader followings, complemented by increasing institutional adoption following its inclusion in major indices.
- Commercial AI Platform Growth: Rapid revenue expansion within US commercial enterprises provides strong quarterly growth metrics that drive high-volume breakout setups.
- High Daily Range (ATR): Palantir offers a generous Average True Range relative to its share price, giving intraday traders ample price movement to capitalize on structural chart patterns.
Key Factors Driving Massive Daily Trading Volume
Unusually high trading volume in individual equities rarely occurs by accident. Specific fundamental, structural, and technical catalysts regularly trigger liquidity spikes across the stock market.
| Catalyst Category | Market Impact & Volume Mechanism |
|---|---|
| Quarterly Earnings Reports | Massive repricing based on revenue, EPS, and forward Guidance updates |
| Options Market Expirations (OpEx) | Quadruple Witching & dealer gamma hedging drive forced share trading |
| Index Rebalancing | S&P 500 and Russell index fund inclusion forces automatic buying/selling |
| Macroeconomic Data Releases | CPI, Fed rate decisions, and jobs reports trigger systematic portfolio shifts |
| Institutional Block Trades | Pension & mutual funds rebalancing multi-million-dollar positions |
1. Quarterly Earnings Releases and Management Guidance
Four times a year during earnings season, corporations publish detailed financial statements outlining revenue, net income, profit margins, and future financial projections. Surprises—whether positive or negative—cause immediate revaluations. Analysts and automated execution algorithms adjust financial models instantly, resulting in trading volume spikes that can be five to ten times higher than a stock’s 30-day moving average.
2. Options Expiration and Dealer Gamma Hedging
The derivatives market plays a massive role in driving spot equity volume. On options expiration dates—particularly quarterly Quadruple Witching sessions when stock options, index options, stock futures, and index futures expire simultaneously—institutions adjust complex derivative positions. When options volume swells in stocks like NVDA or TSLA, market makers must dynamically buy or sell underlying shares to maintain delta-neutral positions, driving spot volume higher.
3. Index Additions, Removals, and Rebalancing
When benchmark index providers rebalance their components—such as the S&P 500, Nasdaq-100, or Russell 2000—trillions of dollars in index-tracking passive funds must immediately match the new weightings. On the effective date of index changes, affected stocks frequently experience record-setting volume during the closing auction, as fund managers trade millions of shares simultaneously at the official market close price.
4. Macroeconomic Announcements and Federal Reserve Policy
Broad macroeconomic catalysts, such as Consumer Price Index (CPI) inflation reports, non-farm payroll employment data, and Federal Reserve interest rate decisions, influence overall market liquidity. When interest rate expectations shift, systematic quantitative strategies and macro hedge funds rapidly adjust capital allocations across major tech and financial equities.
How High Volume Impacts Bid-Ask Spreads and Execution Speed
Understanding the mechanics of order matching highlights why high-volume equities are preferred by active market participants.
The Dynamics of Bid-Ask Spreads
The bid represents the maximum price buyers are willing to pay, while the ask represents the minimum price sellers are willing to accept. In illiquid stocks, the spread between bid and ask might be $0.20 to $1.00 or wider. Buying at the ask and immediately selling at the bid results in an instant, guaranteed loss equal to the spread.
In ultra-high-volume stocks like Apple, Nvidia, or Advanced Micro Devices, the bid-ask spread is virtually always $0.01 (a single penny) wide. Because thousands of limit orders sit at every penny increment on the Level 2 order book, market participants enjoy exceptionally low friction costs.
Illiquid Stock Order Book: [Bid: $50.00 x 200 shares] <— Spread = $0.50 —> [Ask: $50.50 x 100 shares] (High friction, high slippage risk)
Liquid Stock Order Book (e.g., NVDA, AAPL): [Bid: $150.00 x 15,000 shares] <— Spread = $0.01 —> [Ask: $150.01 x 18,000 shares] (Ultra-low friction, near-instant execution)
Execution Speed and Dark Pools
High-volume stocks benefit from lightning-fast order routing. Major electronic communication networks (ECNs) and market-making internalizers process orders within milliseconds. Furthermore, institutional investors executing multi-million-dollar orders rely on off-exchange execution venues known as dark pools. Dark pools allow institutional managers to trade massive share blocks anonymously without broadcasting their intentions to the open market, preventing sudden market panic or artificial price spikes.
Trading Strategies for High-Volume Equities

Active traders employ specific methodologies tailored to high-volume market environments. Because liquid equities exhibit clean technical structure, traders utilize specialized execution strategies.
1. Intraday Momentum and Breakout Trading
Momentum traders monitor relative volume spikes at key technical chart levels. When a high-volume stock consolidates beneath a multi-day resistance level and breaks out accompanied by above-average volume, it signals aggressive buyers clearing available sell orders.
Breakout Execution Framework
- Identify Resistance: Locate a clearly defined horizontal price barrier touched multiple times on the 5-minute or 15-minute timeframe.
- Monitor Relative Volume (RVOL): Ensure volume on the breakout candle exceeds the average volume of preceding candles by at least 150-200%.
- Risk Management: Place a stop-loss order just inside the consolidation range to protect against false breakouts.
2. VWAP Mean Reversion Strategies
The Volume-Weighted Average Price (VWAP) is a technical indicator that calculates the true average price a stock has traded at throughout the session, weighted by volume at each price level. Institutional execution desks use VWAP as a benchmark to ensure orders are filled at fair market value.
How Traders Utilize VWAP
- Institutional Support/Resistance: When a high-volume stock pulls back toward its intraday VWAP line during a strong uptrend, institutional algorithms often re-enter buying programs, creating low-risk entry points.
- Overextended Stretches: If price moves too far above or below the VWAP (measured by standard deviation bands), short-term mean-reversion traders initiate positions expecting price to pull back toward the volume-weighted average.
3. Covered Call and Cash-Secured Put Income Strategies
Investors seeking cash-flow generation leverage high volume in options chains. Because liquid stocks like Apple, Microsoft, and Tesla feature high option volume across all expiration dates, bid-ask spreads on option contracts remain extremely narrow.
- Covered Calls: An investor holding 100 shares of a high-volume stock sells an out-of-the-money call option against their position, collecting option premium income while maintaining downside equity exposure.
- Cash-Secured Puts: An investor sets aside cash to sell an out-of-the-money put option at a target purchase price. If the stock drops to that strike price, they are assigned shares at a discount while keeping the option premium collected upfront.
The Role of Volume Indicators in Technical Analysis
To trade high-volume equities effectively, analysts rely on technical indicators that incorporate volume directly into price formulas.
| Volume Indicator | Primary Function & Interpretation |
|---|---|
| On-Balance Volume (OBV) | Measures cumulative buying and selling pressure over time |
| Volume-Weighted Average Price (VWAP) | Shows the true intraday average price weighted by traded volume |
| Volume Profile | Displays total volume traded at specific price levels (Price-By-Volume) |
| Chaikin Money Flow (CMF) | Combines price location and volume to assess institutional accumulation |
On-Balance Volume (OBV)
Developed by Joseph Granville, On-Balance Volume (OBV) is a cumulative momentum indicator that relates price changes to total volume flow.
When OBV makes higher highs while stock price remains flat, it signals covert institutional accumulation, often preceding a bullish price move. Conversely, if OBV trends downward while price makes new highs, bearish divergence suggests smart money is distributing shares into retail strength.
Volume Profile and Point of Control (POC)
Unlike traditional volume histograms displayed at the bottom of a chart (which show volume per unit of time), Volume Profile plots volume horizontally along the vertical price scale. This reveals exactly at which price levels the greatest concentration of trading activity occurred.
- Point of Control (POC): The single price level where the highest volume was traded during a specified period. The POC acts as a strong magnetic level where price frequently finds equilibrium.
- High-Volume Nodes (HVN): Price regions characterized by heavy trading activity, representing accepted fair value where consolidation often takes place.
- Low-Volume Nodes (LVN): Price regions with minimal historical trading activity. Price typically moves rapidly through LVNs because little institutional liquidity stands in the way.
Risks and Misconceptions Associated with High-Volume Stocks
While high trading volume offers numerous structural benefits, investors must navigate specific risks and common market misconceptions.
Misconception 1: High Volume Always Means Price Will Go Up
A common mistake among novice traders is assuming that a massive surge in trading volume automatically signals a bullish trend. Volume represents both buying and selling equally. Every single share purchased requires a seller on the other side of the trade. Heavy volume accompanying a major breakdown below a critical support level indicates aggressive, high-conviction selling pressure, which can trigger prolonged downtrends.
Misconception 2: Popularity Guarantees Long-Term Outperformance
Stocks that attract the highest daily trading volume are often high-beta, media-saturated companies. While top-traded stocks include world-class businesses, hype and retail enthusiasm can drive valuations far beyond sustainable underlying fundamentals. Investing blindly in high-volume market leaders without analyzing balance sheets, earnings quality, debt loads, and price-to-earnings ratios can expose capital to severe drawdowns during market corrections.
Risk Factor: Crowded Trades and Sudden Liquidity Gaps
When a stock becomes a “crowded trade”—where thousands of retail traders, quantitative algorithms, and hedge funds sit on the exact same side of the market—position unwinding can be violent. If bad news hits during pre-market or after-hours sessions when liquidity thins out, high-volume stocks can gap down dramatically before standard trading hours resume, bypassing intraday stop-loss orders.
Essential Key Takeaways for Traders and Investors
Navigating the stock market’s most liquid assets requires balancing technical analysis with disciplined risk management. Here is a summary of core principles to keep in mind:
- Volume Reflects Liquidity: Highly traded equities like Nvidia, Tesla, Apple, and Microsoft offer tight bid-ask spreads, low slippage, and immediate order execution, making them ideal vehicles for both active traders and long-term portfolio builders.
- Distinguish Between Share Volume and Dollar Volume: Low-priced stocks often lead share volume counts, but high-priced mega-cap tech giants dominate total dollar volume and institutional capital flow.
- Use Volume to Validate Technical Signals: Breakouts, trend continuations, and support bounces are far more reliable when accompanied by above-average volume expansion.
- Leverage Specialized Volume Tools: Incorporate VWAP, On-Balance Volume (OBV), and Volume Profile into your charting layout to identify where institutional order flow and fair-value liquidity rest.
- Maintain Structural Risk Control: Never confuse liquidity with safety. Always manage position sizing, utilize stop-loss discipline, and evaluate underlying fundamental metrics before deploying capital into high-volume market leaders.