How do stock prices rise and fall?
For many new investors, watching a stock ticker is like watching a heart monitor. The numbers flash green and red, moving up and down with a frequency that can feel chaotic and unpredictable. You might see a company announce record profits only for its stock price to drop, or a company lose millions while its stock price soars.
Why does this happen? What are the invisible hands pulling the strings of the global markets? Understanding the mechanics behind price movements is the difference between “gambling” on stocks and making informed investment decisions. This guide will walk you through the complex ecosystem that dictates the value of your portfolio.
The Core Mechanic: The Law of Supply and Demand

At its most fundamental level, the stock market is a giant, global auction house. The price of a stock moves based on the interaction between buyers (demand) and sellers (supply).
If more people want to buy a stock than sell it, the price goes up. If more people want to sell a stock than buy it, the price goes down. This is the Law of Supply and Demand in its purest form.
The “Market Price” Illusion
The price you see on your screen isn’t a fixed value set by the company; it is simply the price of the last transaction that took place. If the last person to buy a share of “Company X” paid $150.05, then the “market price” is $150.05$. If the next person is only willing to pay $\$150.00$, and a seller agrees, the price instantly drops.
Factors Affecting Supply and Demand
-
Supply: Can be affected by “Stock Buybacks” (reducing supply, which usually raises price) or “Secondary Offerings” (issuing new shares, which increases supply and usually lowers price).
-
Demand: Driven by everything from fundamental performance to social media trends.
The Fundamental Driver: Corporate Earnings and Financial Health
While supply and demand are the “how,” earnings are often the “why.” Every three months, public companies are required to release an Earnings Report. This is the company’s “report card,” and it is the most significant fundamental event for any stock.
The Expectation Game
The market doesn’t just react to the numbers; it reacts to how those numbers compare to Wall Street expectations.
-
The Beat: If a company was expected to earn $1.00 per share but actually earned $1.20, the stock often rallies.
-
The Miss: If they earned $0.95, the stock might tank, even though they still made a profit.
Key Metrics to Watch
Investors look at several key formulas to determine if a price move is justified:
-
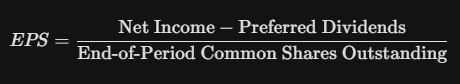
Earnings Per Share (EPS):
-
Price-to-Earnings Ratio (P/E):
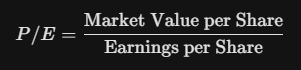
If the P/E ratio becomes too high compared to the industry average, investors may decide the stock is “overvalued” and start selling, causing the price to descend.
The Macroeconomic Environment: How the “Big Picture” Hits Your Wallet
Stocks do not exist in a vacuum. They are part of a global economy, and major shifts in that economy can lift all boats or sink the entire fleet.
1. Interest Rates and the Federal Reserve
In the United States, the Federal Reserve (The Fed) is the most powerful entity in the markets. When the Fed raises interest rates, it becomes more expensive for companies to borrow money to grow. Higher rates also make “safe” investments like bonds more attractive, which often leads investors to pull money out of “risky” stocks.
General Rule: When interest rates go up, stock prices (especially in tech and growth sectors) tend to go down.
2. Inflation and Purchasing Power
Inflation is the silent killer of returns. If the cost of raw materials (steel, oil, labor) goes up, a company’s profit margins shrink. Unless the company can pass those costs on to consumers, their stock price will likely suffer.
3. Gross Domestic Product (GDP)
GDP represents the total value of goods and services produced. A growing GDP means a healthy economy where people are spending money, which leads to higher corporate revenues and rising stock prices.
Market Sentiment: The Psychology of Fear and Greed
If the stock market were purely logical, prices would only move on news. But the market is made of humans (and algorithms designed by humans), which means emotion plays a massive role.
The Fear and Greed Index
Investors often oscillate between two extremes:
-
Greed (FOMO): “Fear Of Missing Out” causes people to buy stocks at record highs because they see everyone else making money. This creates “bubbles.”
-
Fear (Panic Selling): When a small dip starts, fear can snowball. Investors sell to “protect what they have left,” creating a downward spiral that can lead to a market crash.
Market Momentum
Sometimes a stock goes up simply because it is already going up. This is called “Momentum.” Traders jump on the trend, pushing the price far beyond what the company’s actual value would suggest. Eventually, the trend breaks, leading to a sharp correction.
The Role of News and Media: “Buy the Rumor, Sell the News”
Have you ever noticed a stock price rising for days before a big announcement, only to see it crash the moment the announcement is made? This is a common phenomenon in the markets.
Pricing in the News
The market is “forward-looking.” This means that if investors think a company is going to win a big contract, they start buying the stock today. By the time the contract is officially signed, that success is already “priced in.” There are no more buyers left to push the price higher, so the early investors sell to take their profits, causing the price to fall.
The Impact of Headlines
In the age of 24-hour news and social media, a single tweet or a breaking news headline can trigger thousands of “Stop-Loss” orders. This creates instant, high-velocity price movements that have nothing to do with the company’s long-term value.
Technical Analysis: When Computers Drive the Price

A significant portion of daily trading volume isn’t done by humans—it’s done by high-frequency trading (HFT) algorithms. These computers don’t care about a company’s CEO or its products; they care about patterns.
Support and Resistance Levels
-
Support: A price level where a stock historically struggles to fall below. Buyers tend to step in at this price.
-
Resistance: A price level where a stock historically struggles to rise above. Sellers tend to step in at this price.
When a stock “breaks through” a resistance level, it often triggers a wave of automated buying, causing a rapid price spike. Conversely, “breaking support” can trigger a wave of automated selling.
Institutional “Whales” vs. Retail Investors
To understand price movement, you have to follow the “Big Money.”
-
Institutional Investors: These are pension funds, insurance companies, and mutual funds. They trade millions of shares at a time. Because they are so large, they cannot buy or sell their entire position in one day without destroying the price. Their movements create long-term “trends” that can last months or years.
-
Retail Investors: Individual investors like us. While one retail investor can’t move the market, millions of them acting together (as seen in “meme stock” events) can create massive, short-term volatility.
Corporate Actions: Buybacks, Dividends, and Splits
Sometimes, the company itself intentionally moves its stock price through corporate maneuvers.
1. Stock Buybacks
When a company has too much cash, it may buy its own shares back from the market. This reduces the number of shares available (supply). Because the same amount of earnings is now divided among fewer shares, the EPS goes up, and the stock price usually follows.
2. Dividends
When a stock goes “Ex-Dividend” (the date when new buyers are no longer entitled to the upcoming dividend), the stock price typically drops by the exact amount of the dividend. This is because the company is literally “paying out” part of its value to shareholders.
3. Stock Splits
A split (like a 2-for-1) doesn’t change the company’s value, but it makes the shares “cheaper” to buy for retail investors. This increased accessibility often leads to a short-term surge in demand, pushing the price up.
Market Liquidity and the Bid-Ask Spread

The “smoothness” of a price move depends on Liquidity.
-
High Liquidity: For a stock like Apple, there are millions of buyers and sellers at every penny. The price moves in tiny, fluid increments.
-
Low Liquidity: For a small, obscure company, there might be no one willing to buy for several minutes. If a seller is desperate, they might have to drop their price by $5\%$ just to find a single buyer. This creates “gaps” in the chart and extreme volatility.
The Bid-Ask Spread
A wide spread usually indicates low liquidity and can lead to sudden, sharp price movements as trades are executed at disparate prices.
Geopolitical Events and “Black Swans”
Finally, there are the events that no one sees coming. These are often called Black Swan events.
Geopolitical tensions, trade wars, pandemics, or sudden changes in government regulations can cause investors to “de-risk” instantly. In these moments, the logic of earnings and P/E ratios goes out the window as investors rush to the exits simultaneously.
The Tug-of-War Never Ends
Stock prices move because the world is constantly changing. Every second, new information is being processed, new trades are being made, and the “tug-of-war” between buyers and sellers is updated.
For the long-term investor, the goal isn’t to predict every wiggle in the line. The goal is to understand the underlying forces so that when the price drops, you can distinguish between a “sale” on a great company and a fundamental collapse of a business.
Prices go down in the short term due to noise, but they go up in the long term due to value creation. Stay focused on the latter, and the volatility becomes your friend rather than your enemy.